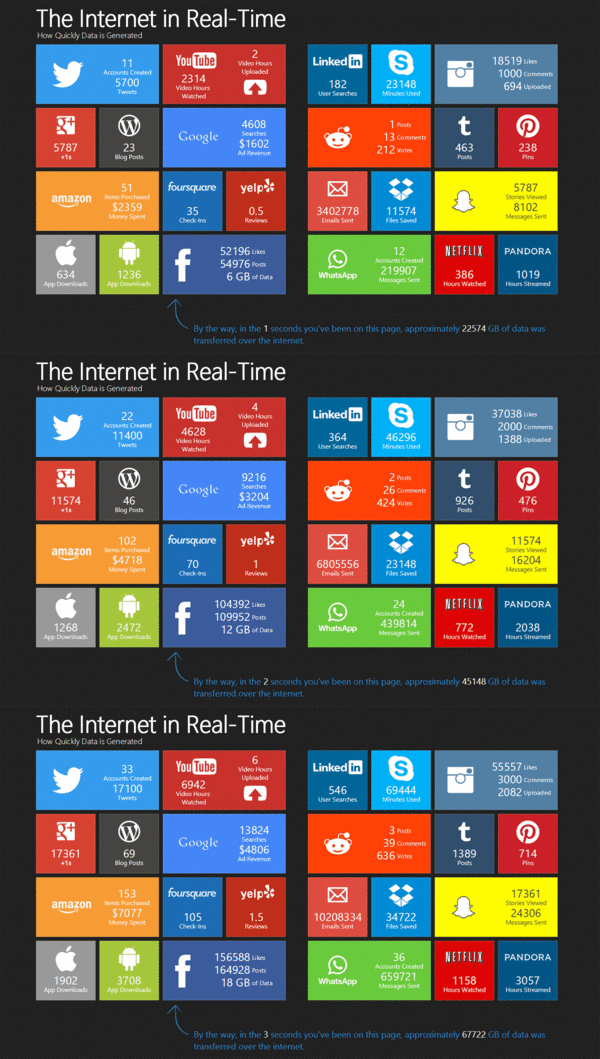
Ever wondered how many blog posts were published every minute?
How about how many tweets are sent? Or videos uploaded?
There are several graphics doing the rounds which visualise an average internet minute, hour or day. However I’d never seen anything that attempted to visualise it in real time.
This site does.
Click the animation to open the full version (via http://pennystocks.la).
Enjoy!


See the Internet In Real Time http://t.co/kGXyvCyfTf via @blacknight
See the Internet In Real Time http://t.co/BHvD3RJyqf
RT @blacknight: See the Internet In Real Time http://t.co/BHvD3RJyqf