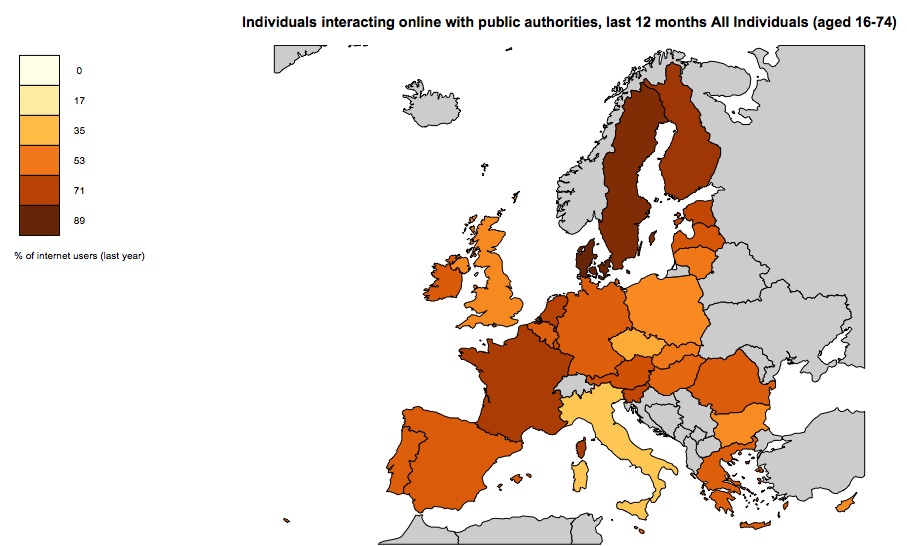
Visualise Irish & European IT Metrics Easily
Everyone loves being able to visualise data and infographics have become very popular in the last couple of years. However being able to generate attractive graphs and graphics requires both skill and access to data. The
