39 Facts About Uber [Infographic]
If you'd invested $20,000 in Uber's angel round in 2010, you'd have a €40 million stake now. It's something to think about! Here's an offbeat analysis of some of the data surrounding Uber - currently valued

We Must Solve the Problem of Jurisdiction to Keep Cyberspace Free-to-Roam – Bertrand de La Chappelle [Video]
The internet has no borders; increasingly things get complicated when questions of jurisdiction arise. Bertrand de La Chappelle runs The Internet and Jurisdiction Project, based in Paris, which is working to to establish "a global, issue-based,
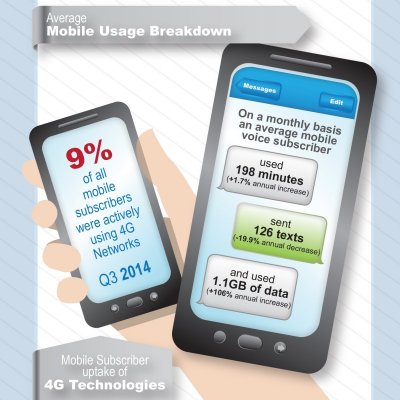
ComReg Report Shows Mobile Data Up 75% as Texting Declines
The volume of data on mobile networks in Ireland has increased by over 75% in the past year, while texting (SMS) has decreased by almost 20% in the same period according to the latest Quarterly Report by

Facebook Flat but Dominant in Latest Irish Social Media Survey
61% of Irish people aged 15 and over have a Facebook account: more than twice the number on Twitter, its nearest rival at 29%. That's according to the latest Ipsos MRBI Social Networking Quarterly Survey published today. Twitter

This is What Big Data Looks Like
Sorry - but it's good for a giggle! Via Visual Idiot on Twitter.

Getbulb Breaks Down the Referendum Result
When it comes to politics, the story's in the data, and it always has been. Interpreting "the numbers" has traditionally been the preserve of a priest-like caste of tallymen and vote managers, who possess the ability to