Infographic – Does Facebook Really Work?
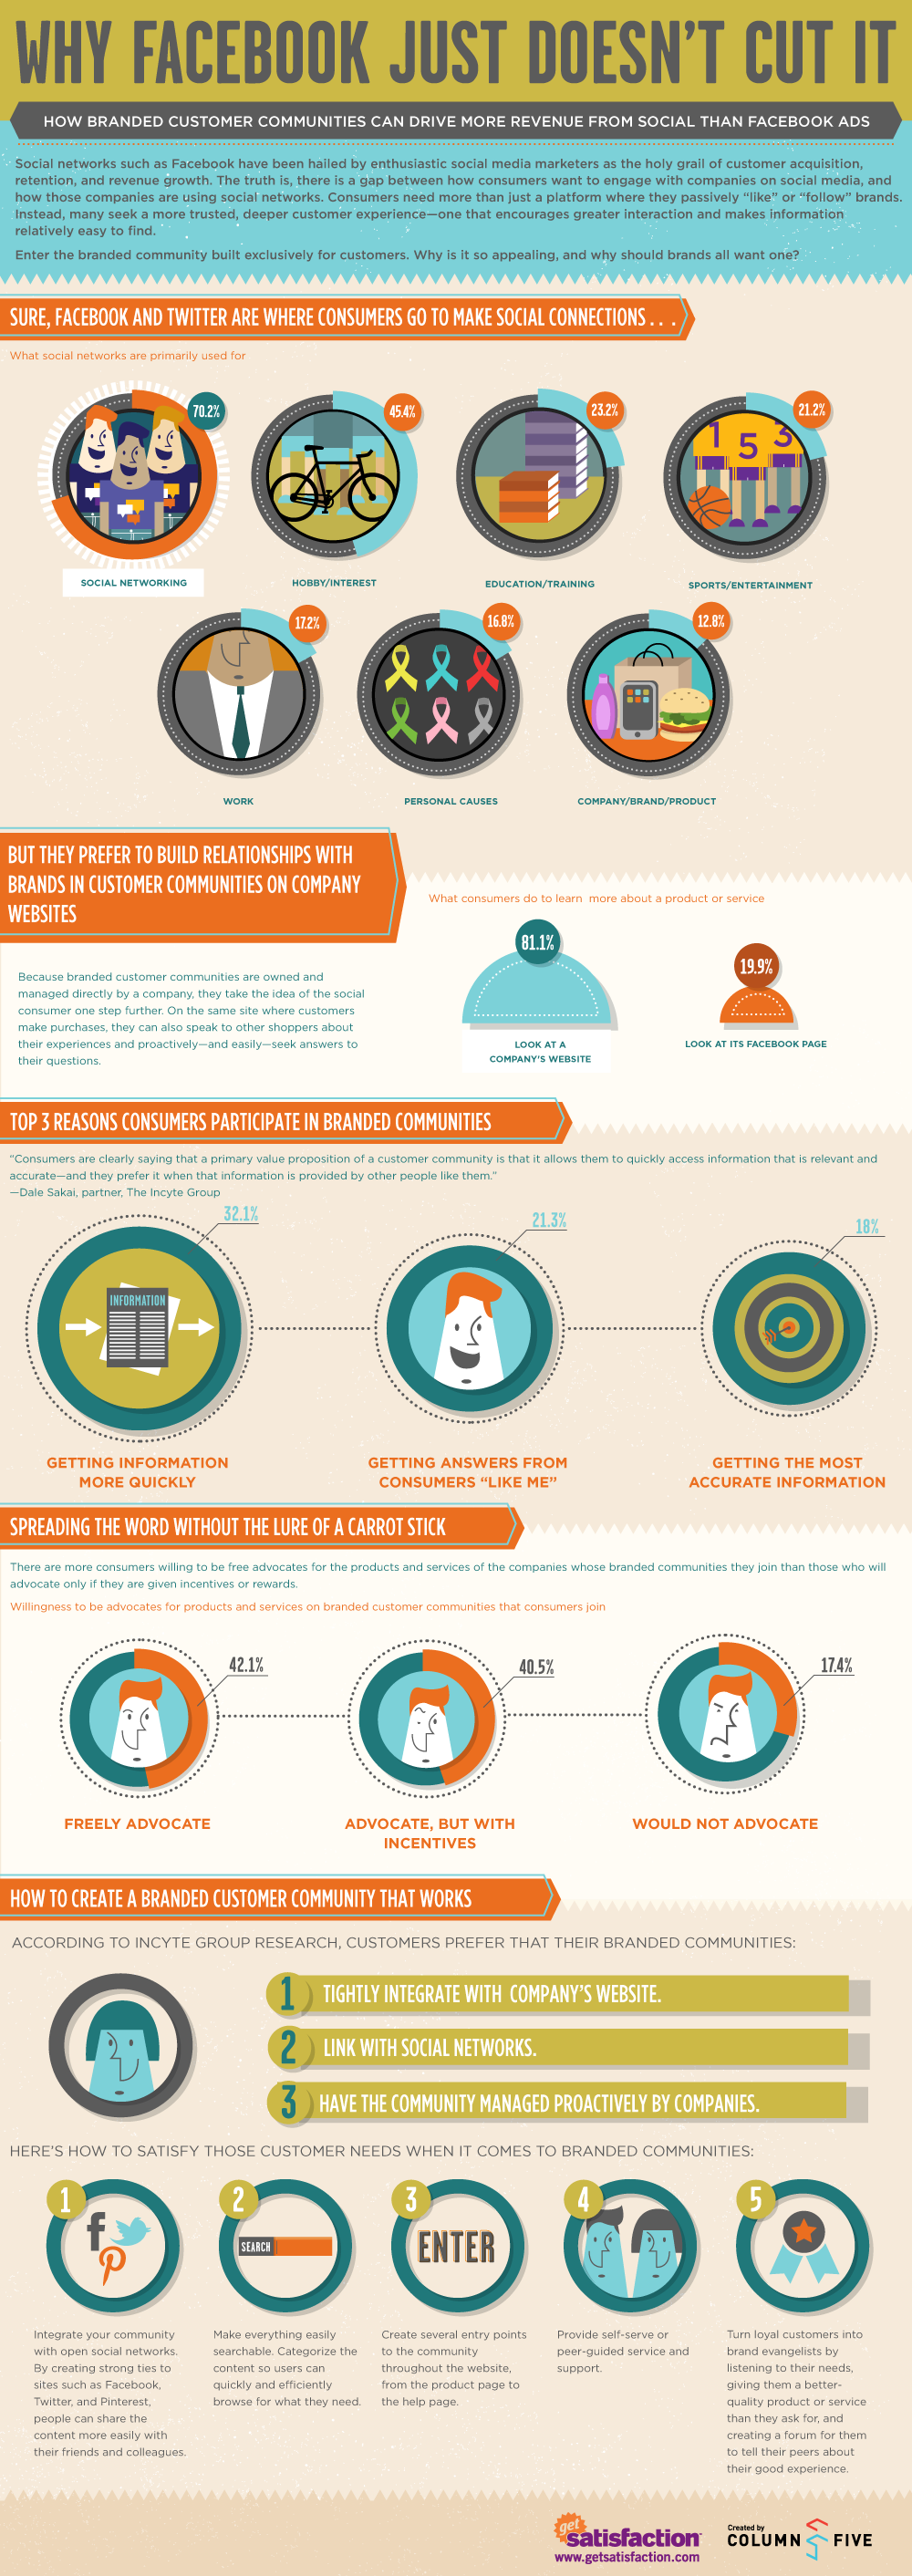
The guys over at Get Satisfaction have posted an interesting infographic on some of the shortcomings of Facebook for user engagement
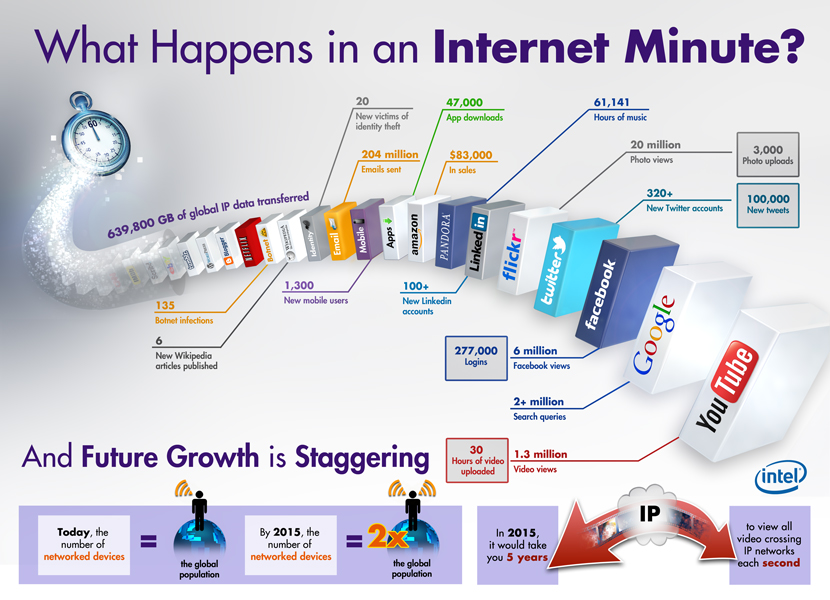
An Internet Minute
Intel released this infographic a while back about everything that happens every minute on the internet with some projections of what things will look like in a couple of years time. The statistics are staggering, especially
Olympics and Social
The London 2012 Olympics were tracked, tweeted, "liked" and shared via multiple social media platforms like Twitter, Facebook, Pinterest, Youtube and many more. The guys over at SEO.com put together a pretty interesting infographic London
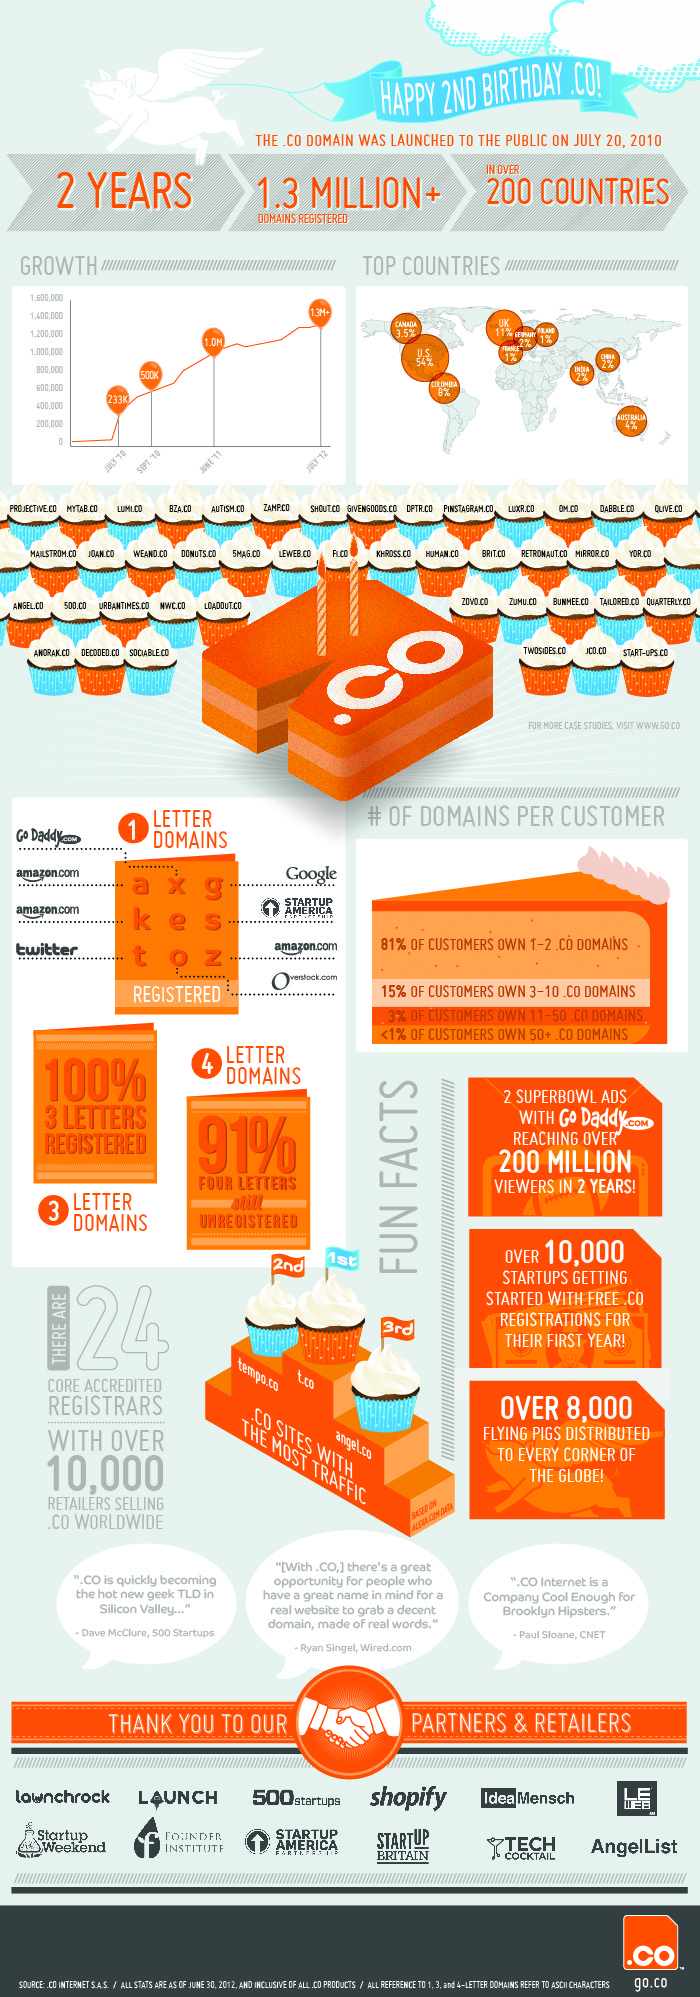
DotCo 2 Years Infographic
Pretty slick graphic from the guys in .co to show their achievements in the first 2 years of operation .co 2 year infographic
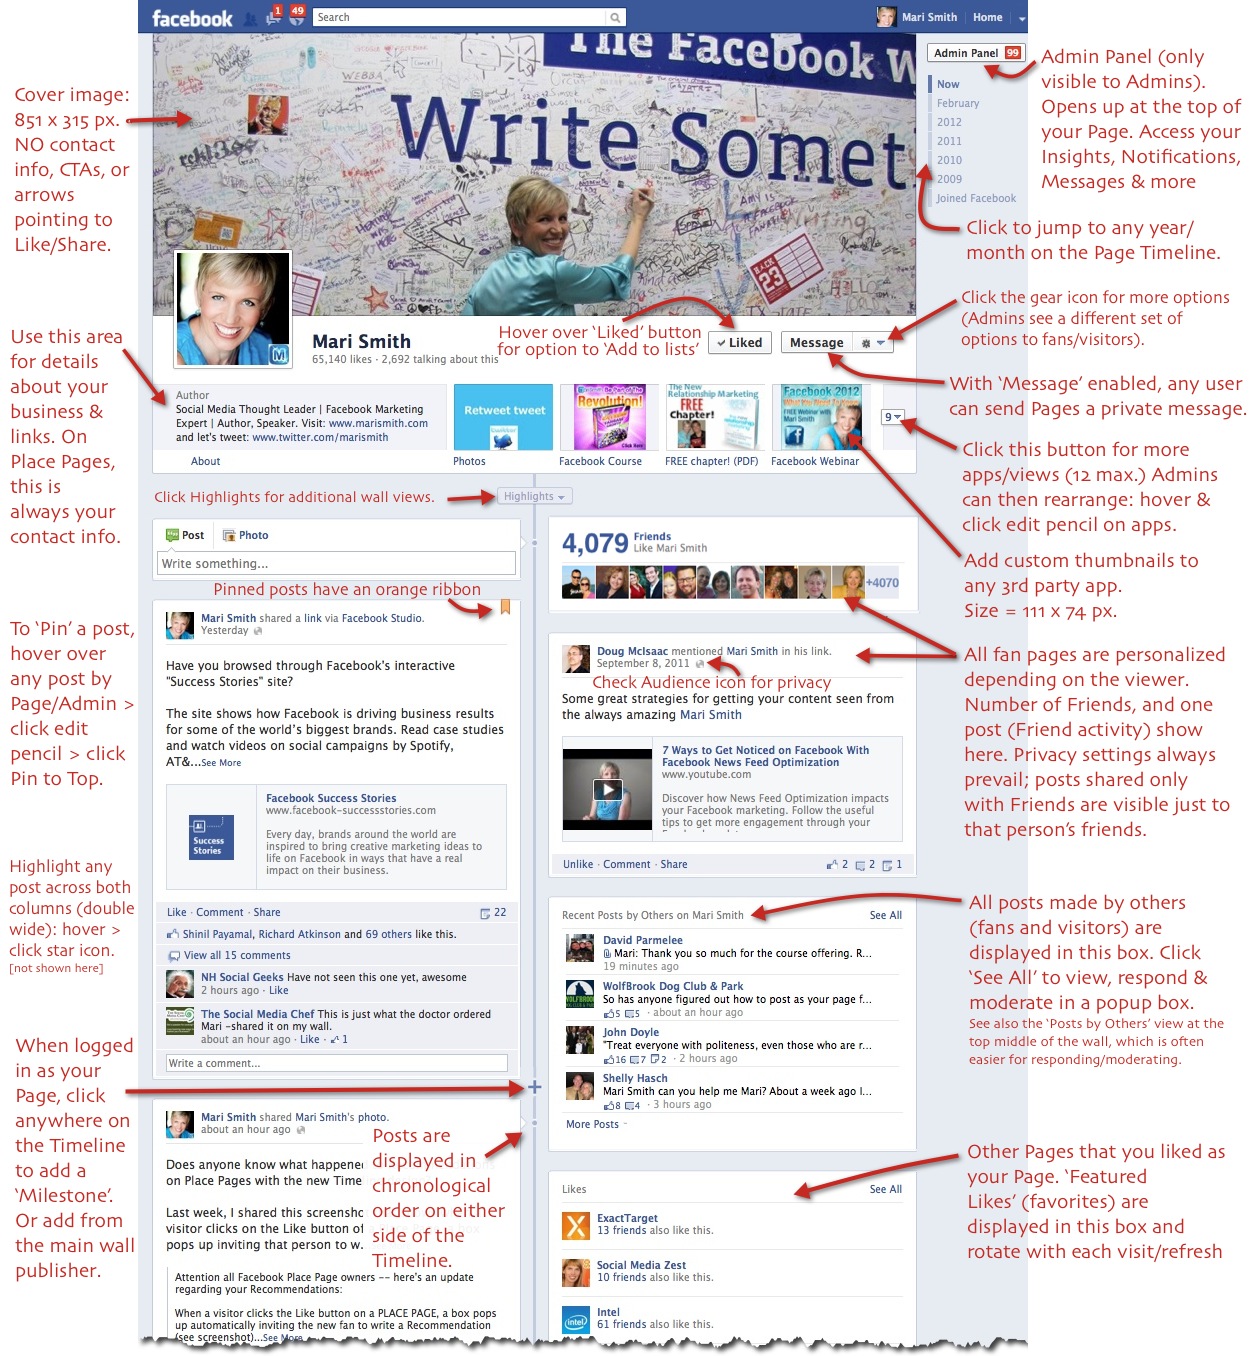
Another Facebook Timeline Infographic
And here's another infographic to help people get to grips with the new timeline:
Are You Using Pinterest Yet?
Pinterest "soft launched" a few months ago, but in the recent weeks it not only opened its doors to the public, but rapidly became one of the hottest online properties. So, are you using it yet?


