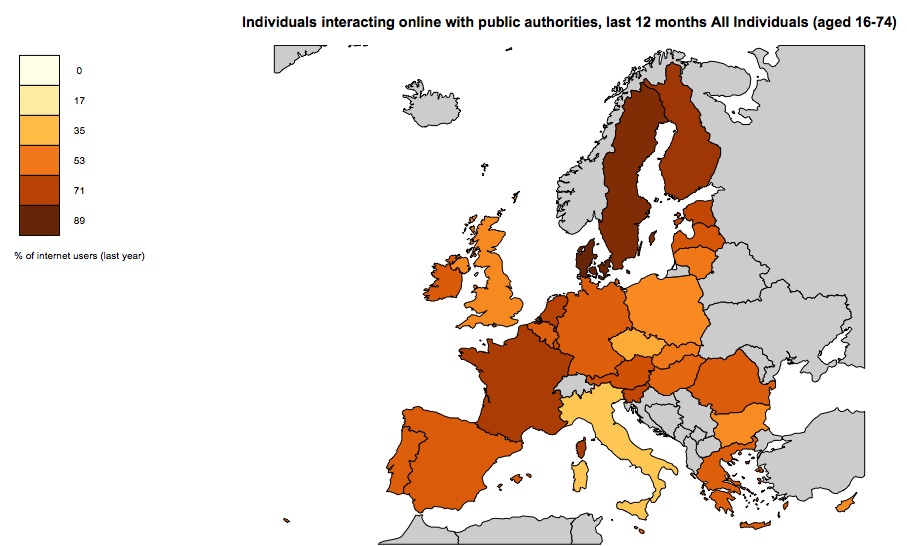
Visualise Irish & European IT Metrics Easily
Everyone loves being able to visualise data and infographics have become very popular in the last couple of years. However being able to generate attractive graphs and graphics requires both skill and access to data. The
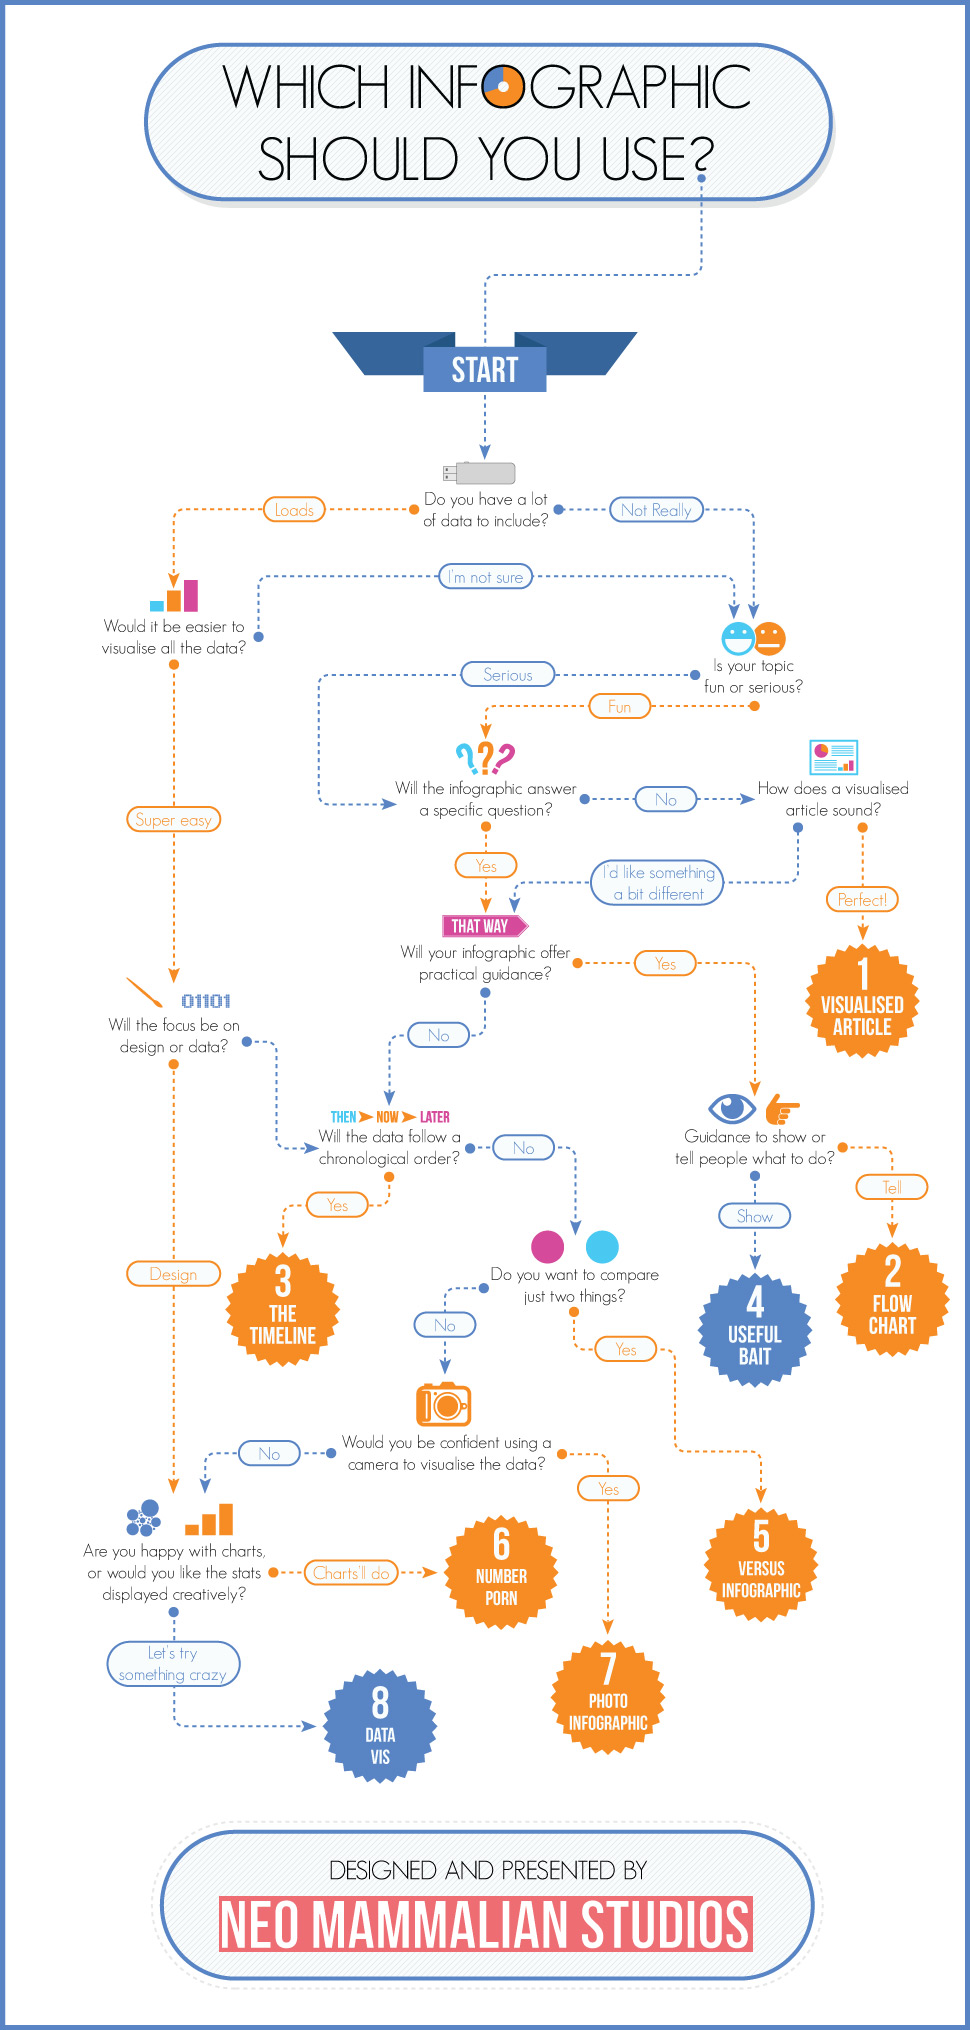
Choosing The Right Infographic
Using a graphic of some kind to illustrate a report or to make some statistics "come alive" is a good idea, but not every type of data is suited to the same type of visual presentation.
The Rise of Android
If you're an Android user then this graphic might be of interest. Plenty of data about Android! Via


