
‘Home Alone’ Security with 2015 Technology
2015 will see the 25th anniversary of 'Home Alone', starring Macaulay Culkin. In the film 8-year-old Kevin McCallister single handedly defends his family home against a pair of comically incompetent burglars using an array of funny

The Evolution of Christmas Presents
The guys over at Carphone Warehouse have produced a really interesting graphic that charts the evolution of popular Christmas presents over the past 30 years. How old were you in 1984? What did you want for
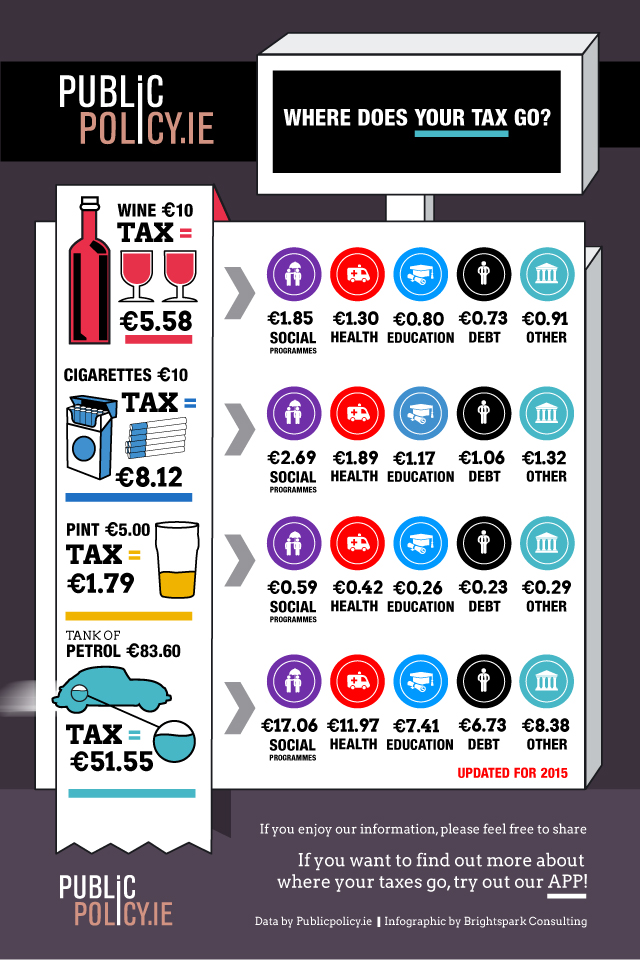
The ‘Old Reliables’: Where Does the Tax Go? [Infographic]
Minister Noonan left the Old Reliables largely unchanged in this week's budget, though he did add 40c to the price of 20 cigarettes. But how much is the tax on these items, and how is it spent?

Infographic: 2014 International Color Trends by Shutterstock
Stock images company Shutterstock recently blogged about the design trends apparent in 2014, and how they differ from country to country. But what may be even more fundamental than design, is colour itself. So here's an
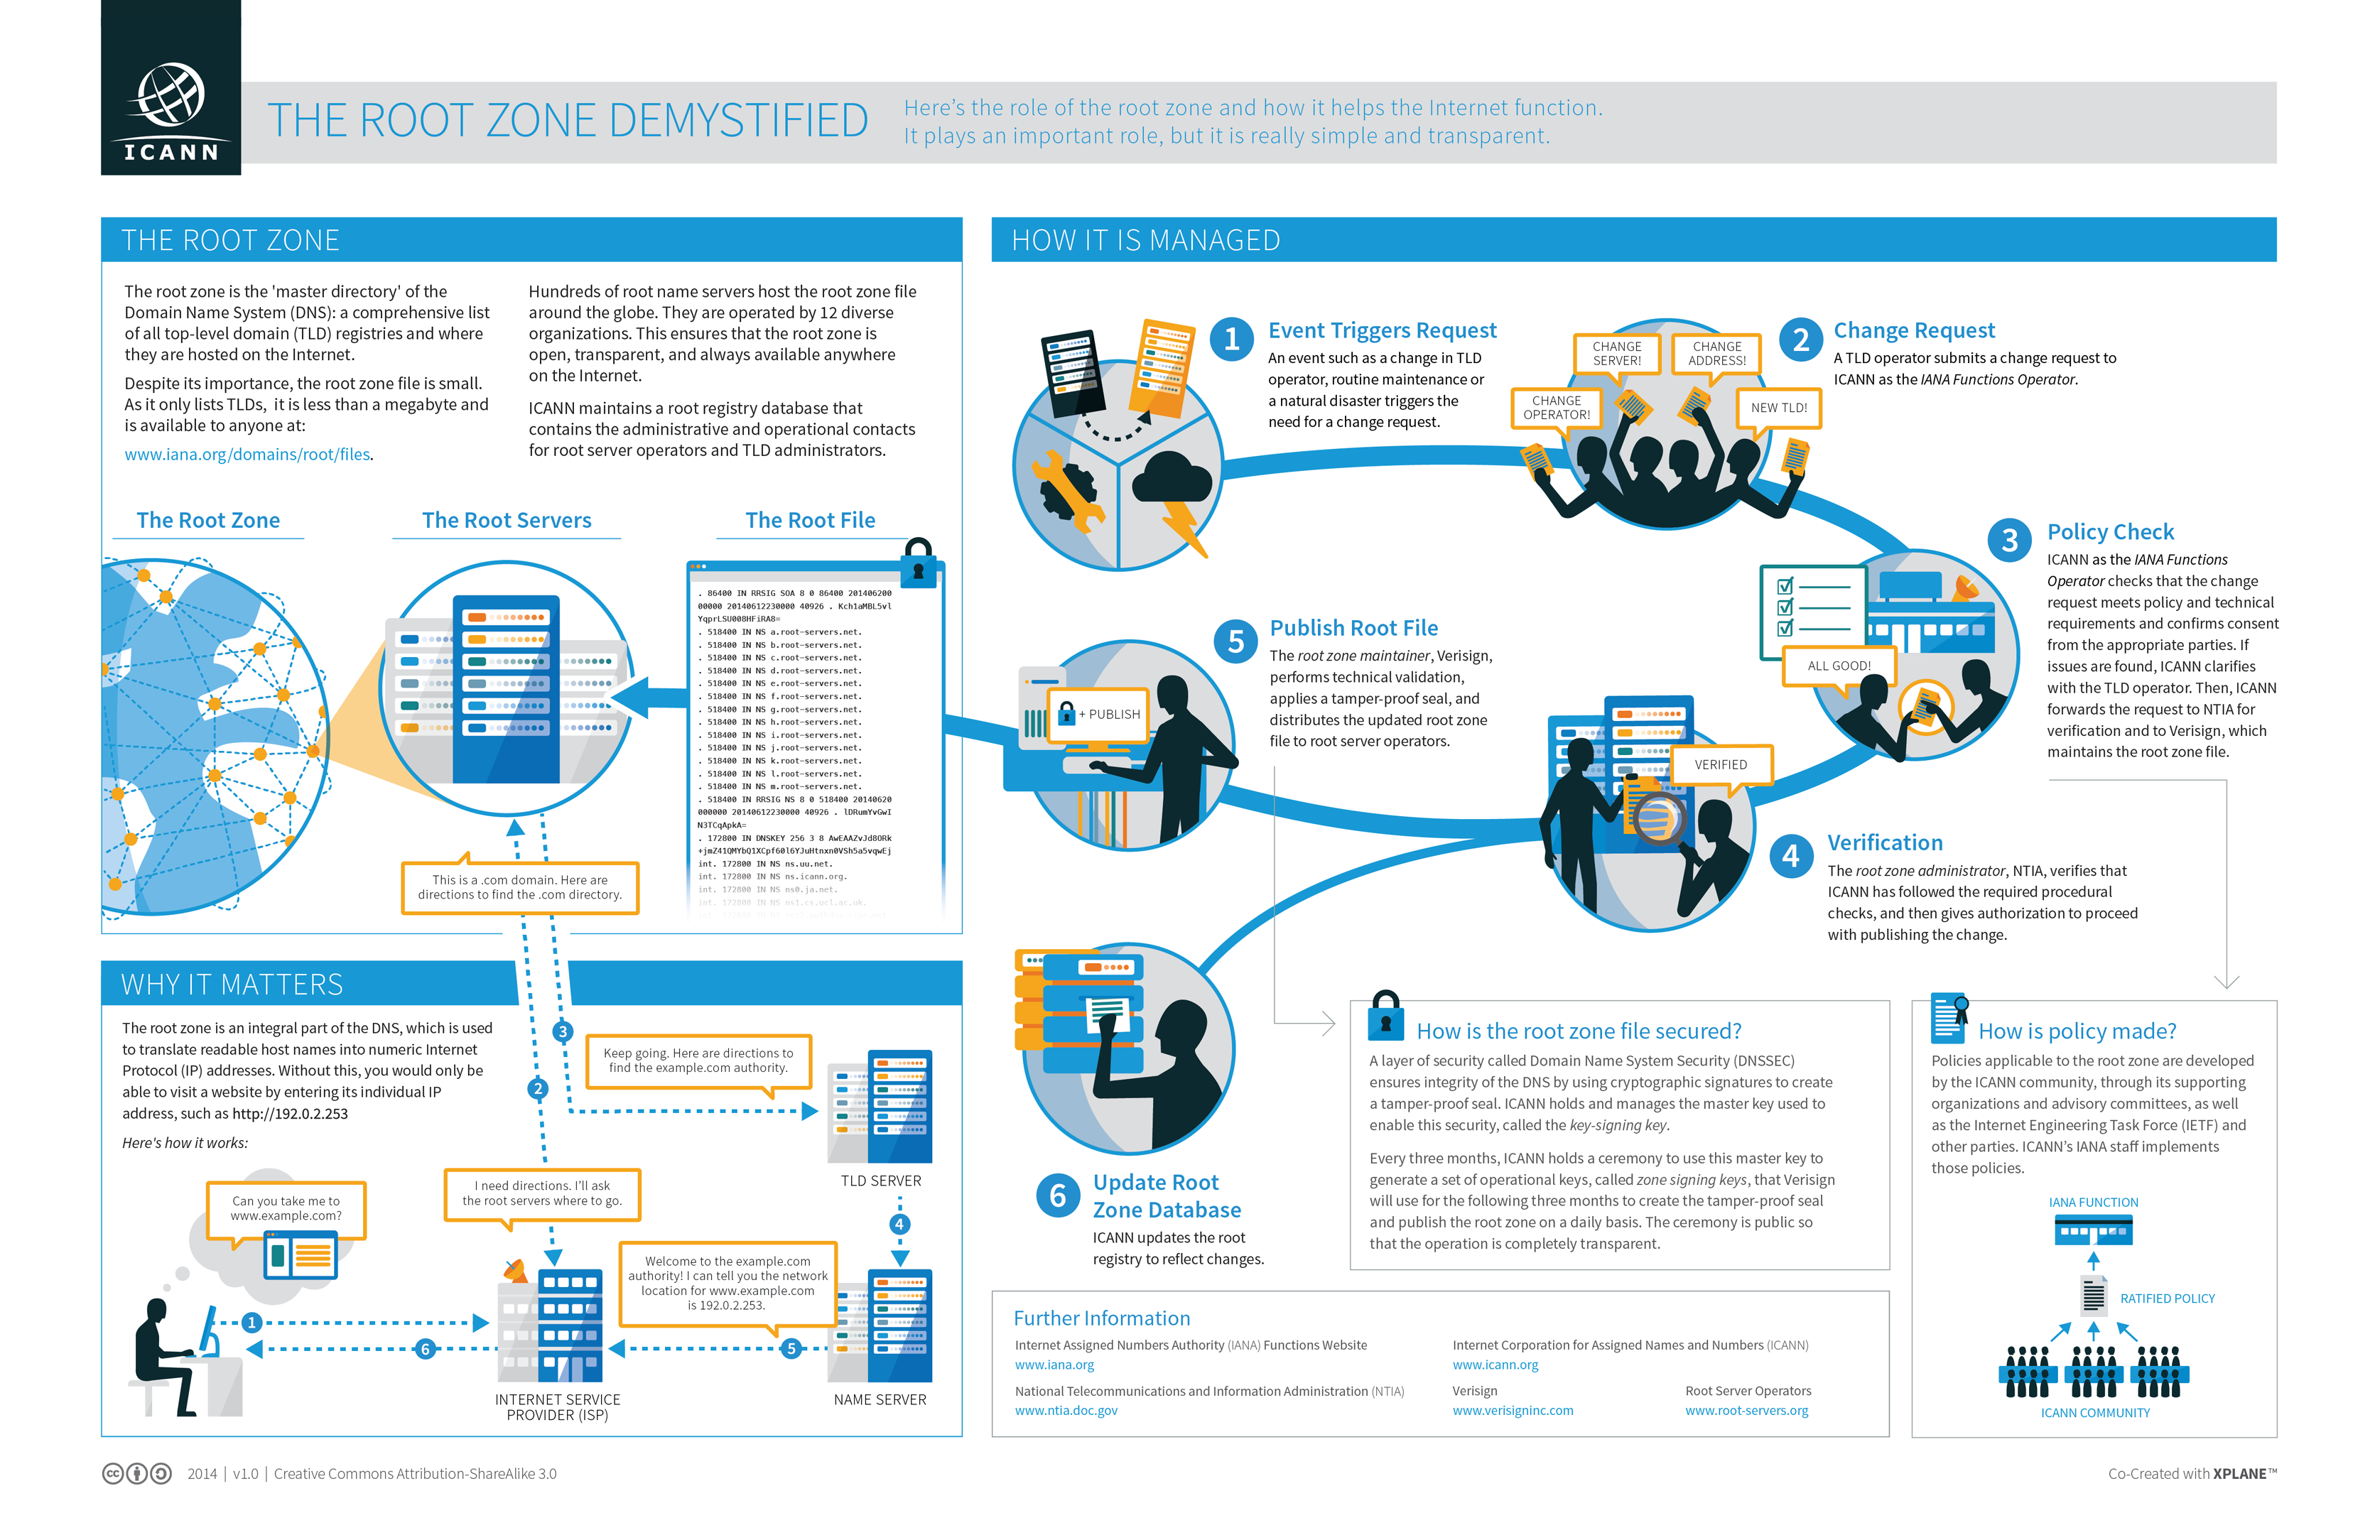
What the hell is the root zone?
We've interviewed several of the key players in new TLDs over the last couple of years, as well as talking quite a bit about domain names and the DNS. But what exactly is the "root zone"?
See the Internet In Real Time
Ever wondered how many blog posts were published every minute? How about how many tweets are sent? Or videos uploaded? There are several graphics doing the rounds which visualise an average internet minute, hour or day.